Waves on the map
Where is the sea highest, and which way is it running? The routing map now shows the waves around your route, as the time cursor moves.
A route's wave chart tells the sea the boat will meet, leg by leg, along one line. But the sea is not a line. A swell born of a storm far out in the Atlantic rolls in for days, a tongue of higher sea spreads across a bay behind a front, a coast shelters the water close in. Whether to stand out to sea or keep near the land, whether to leave tonight or tomorrow, depends on where the big sea lies around the route, where it comes from and where it is heading, not only on the figure the boat meets at noon.
The routing map's Waves button now colours the sea by the significant height of the waves, from blue in a calm sea to red in a heavy one, and purple past eight metres, at the time of the time cursor, the routes drawn over it. White crests drift across it the way the waves travel: the longer their period, the faster they run, and the higher the sea, the longer the crests. Play the cursor and you watch the swell arrive, build and ease off around your track.
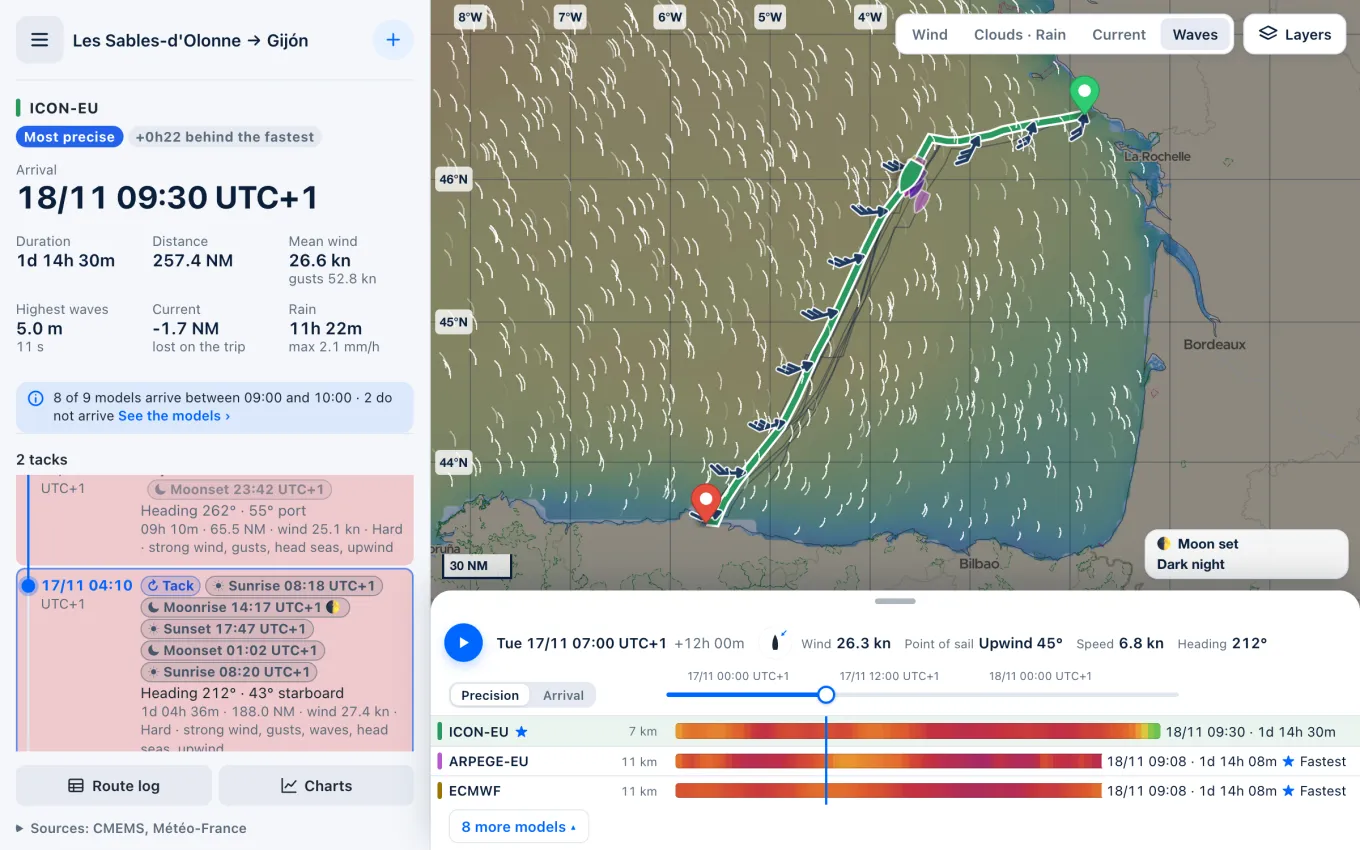
The waves are those of Météo-France's MFWAM model, distributed by Copernicus Marine, over every ocean and sea, on a grid of about nine kilometres, every three hours, ten days ahead: the very run the routes were given, whichever wind model the map shows, so that it tells the same sea as the route's wave chart. The map is there for everyone, with or without an account, on the site and in the apps, where a kept routing downloads its waves with its wind and current, to read offline once the signal is gone.
Say you leave Les Sables-d'Olonne for Gijón in a south-westerly blow veering west and gusting fifty knots, mostly close-hauled on starboard across the Bay of Biscay. The route's summary gives five metres at eleven seconds at worst. The map shows where that sea lies: a long Atlantic swell across the open bay, easing only close to the French and Spanish coasts, its crests marching east across the route, so the boat will take it forward of the beam for a day and a night. Compute again for a departure a day later and play the cursor: if the colours cool towards blue, the wait buys a gentler crossing; if they warm towards yellow and red, it is no time to set out, whatever the wind says.
The waves are shown only: they never change the route, computed on the wind and the current as before. A nine-kilometre grid tells the sea of an area, not what a headland, a bar or a tidal race does to it close in; in some bays and estuaries the sea stays uncoloured over up to a cell where the model has no value, and nothing is made up there. The significant height is about the mean of the highest third of the waves: about once an hour, one stands nearly twice as high. And the crests follow the dominant waves alone, one direction where two swells may cross. Read the map as where the big sea lies and where it is going, and keep an eye on the water.
Sources
- Global Ocean Waves Analysis and Forecast, Copernicus Marine Service
- Significant Wave Height, National Weather Service, Miami
- How are significant wave height, dominant period, average period, and wave steepness calculated?, NOAA National Data Buoy Center