🌦️
Five Models, in Parallel
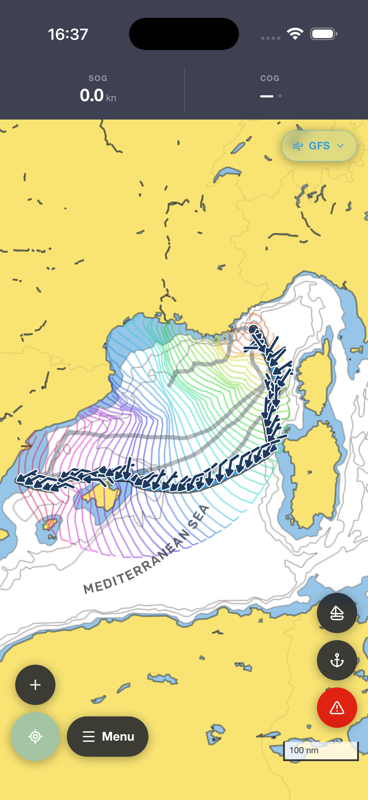
Every routing runs simultaneously across all available forecasts. GRIB files download and refresh automatically — compare results model by model or switch instantly with the on-map pill.
From passage planning to landfall — weather routing, GPS tracking, and nautical charts, all working together.
The same isochrone technique used by offshore race teams — computing the fastest passage across five forecast models at once.
Every routing runs simultaneously across all available forecasts. GRIB files download and refresh automatically — compare results model by model or switch instantly with the on-map pill.
Set a motor speed and a sailing threshold. Legs where the polar speed drops below the threshold are computed as motoring. Amber dashed overlays on the chart and amber shading in the stats make motor portions instantly identifiable.
GRIB files are downloaded for each model and pre-loaded in memory for the departure window.
From the departure, isochrone fronts expand at each time step using polar speeds and real wind vectors.
Land masses are removed. Only the fastest reachable positions on each isochrone are retained.
The time-minimising path from departure to destination is extracted as a GeoJSON feature collection.
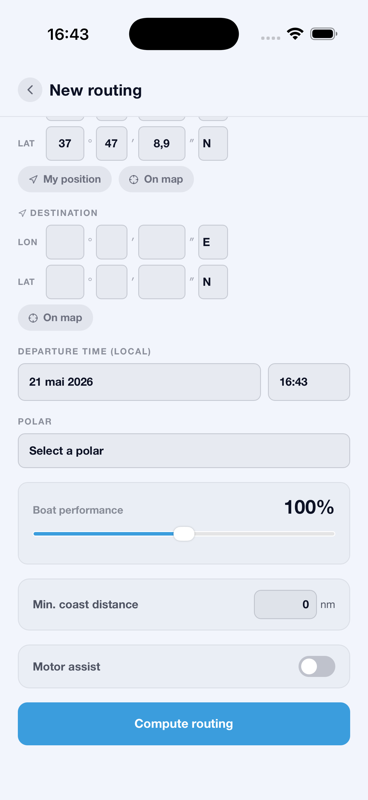
Configure departure, polar & performance
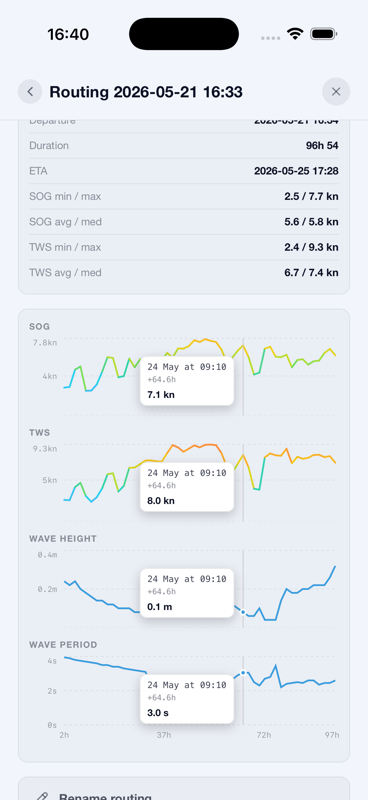
Analyse SOG, TWS & wave forecasts
Isochrones on the nautical chart
Route and isochrones appear directly on the nautical chart. Switch between models with an on-map pill — no need to leave the chart view.
Interactive line charts for SOG, TWS, and significant wave height over elapsed time, with amber shading for motor legs.
Tap any wind barb for DMS coordinates, SOG, TWS, TWA, wind direction, and full wave data (height, direction, period).
Full library of class polars. Choose your boat and set a performance multiplier (50%–150%) for load or sea state.
Every routing persists locally as JSON. Re-run with updated forecasts, rename, or delete. Re-runs are pre-filled.
Duration, ETA, SOG (min / max / avg / median), and TWS statistics for each model that produced a valid result.
A polar curve maps a boat's speed (BSP) as a function of True Wind Angle (TWA) and True Wind Speed (TWS). At each isochrone time step, the engine queries the polar to determine the fastest reachable heading given the local forecast wind. Without an accurate polar, the optimised route is computed for the wrong boat.
Saily ships with ~700 ready-to-use polars sourced and standardised by the open-source sailing community. A performance multiplier (50%–150%) lets you fine-tune for sea state, sail trim, or antifouling condition.
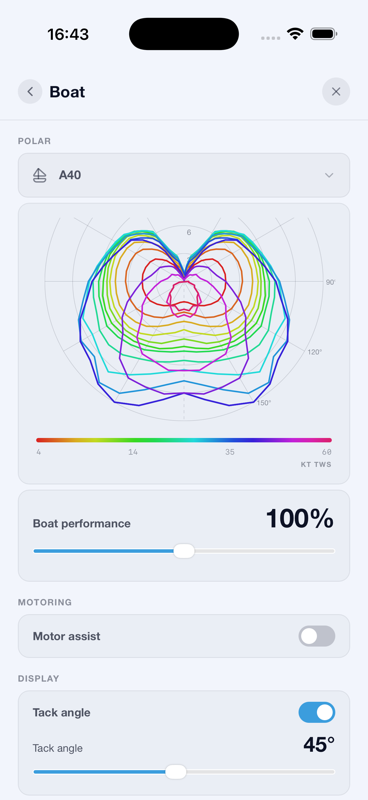
A40 polar curve — choose from ~700 polars
Classes covered span the full spectrum of keelboats and multihulls.
From global ensembles to high-resolution regional models — pick the one that fits your passage, or compare them all side by side.
From marks to MOB — every aspect of on-water navigation, tuned for racing and passage making.
Custom nautical chart with day/night modes and optional Mapbox Satellite basemap. Overlays include official SHOM hydrographic data — lateral and cardinal buoys, beacons, lighthouses (IALA symbology), wrecks, obstructions, and traffic separation schemes — rendered as interactive vector symbols at any zoom.
Real-time position with course and speed over ground displayed in the HUD. Record named tracks with manual start/stop. Background tracking keeps your trace alive even when the screen is off — no data is lost on restart thanks to automatic session recovery.
Tap any buoy, beacon, or waypoint to start navigation. The HUD shows BTW, DTG, XTE, VMC, ETG, and ETA.
Drop, name, and position custom waypoints anywhere on the chart. Editable in DMS, with a one-tap Sail-To shortcut.
Built-in mark sets for major regattas: SRA 2026, SNSM 2026, Voiles Antibes 2026, Croisière Bleue 2026.
Projected heading line with a configurable pointing sector (5°–90°) to visualise tack angle limits at a glance.
Per-track stats: total distance, active sailing duration, average and maximum speed, plus an interactive speed chart.
Tracks colored on a continuous 0–15 kn scale — grey to indigo to amber to red. Spot fast and slow sections instantly.
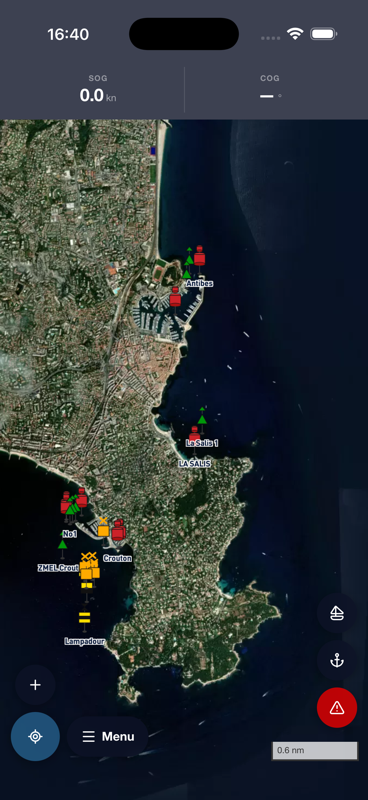
Satellite basemap with nautical overlays
Anchor watch and Man Overboard alerts persist across app restarts — because safety can't wait for a reboot.
Drop anchor and set a drag radius (10–500 m). If the boat leaves the circle, the HUD turns red, 880 Hz audio alerts fire every 2 s, and a vibration is emitted. Move the anchor via crosshair mode. State and radius persist across restarts.
One-tap alert marks the exact overboard position and auto-starts navigation back to it. The HUD shows DTG, BTW, SOG, elapsed time and GPS coordinates. If the app restarts mid-alert, the marker, navigation, and timer are all restored.
Open Saily in your browser, or install it on iOS or Android. Free to try, no account required to explore.